GRAPH Visualization
-

Gephi
Gephi - Graph Visualization
Gephi is a tool for people that have to explore and understand graphs. Like Photoshop but for data, the user interacts with the representation; manipulate the structures, shapes and colors to reveal hidden properties. The goal is to help data analysts to make hypothesis, intuitively discover patterns, and isolate structure singularities or faults during data sourcing. It is a complementary tool to traditional statistics, as visual thinking with interactive interfaces is now recognized to facilitate reasoning. This is software for Exploratory Data Analysis; a paradigm appeared in the Visual Analytics field of research.
Learn More...
-
Graphviz
Graphviz - Graph visualization
Graphviz is open source graph visualization software. Graph visualization is a way of representing structural information as diagrams of abstract graphs and networks. It has important applications in networking, bioinformatics, software engineering, database and web design, machine learning, and in visual interfaces for other technical domains.
Learn More...
-
GUESS
GUESS - The Graph Exploration System
Open Source Graph Visualization Tool
GUESS is an exploratory data analysis and visualization tool for graphs and networks. The system contains a domain-specific embedded language called Gython (an extension of Python, or more specifically Jython) which supports the operators and syntactic sugar necessary for working on graph structures in an intuitive manner. An interactive interpreter binds the text that you type in the interpreter to the objects being visualized for more useful integration. GUESS also offers a visualization front end that supports the export of static images and dynamic movies.
Learn More...
-
Walrus
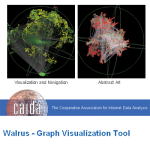
Walrus - Graph visualization software
Open Source Graph visualization Tools
Walrus is a tool for interactively visualizing large directed graphs in three-dimensional space. It is technically possible to display graphs containing a million nodes or more, but visual clutter, occlusion, and other factors can diminish the effectiveness of Walrus as the number of nodes, or the degree of their connectivity, increases. Thus, in practice, Walrus is best suited to visualizing moderately sized graphs that are nearly trees. A graph with a few hundred thousand nodes and only a slightly greater number of links is likely to be comfortable to work with.
Learn More...